
BI Dashboards & Analytics
We create BI dashboards and analytics panels for data visualization, KPI monitoring, and decision-making.
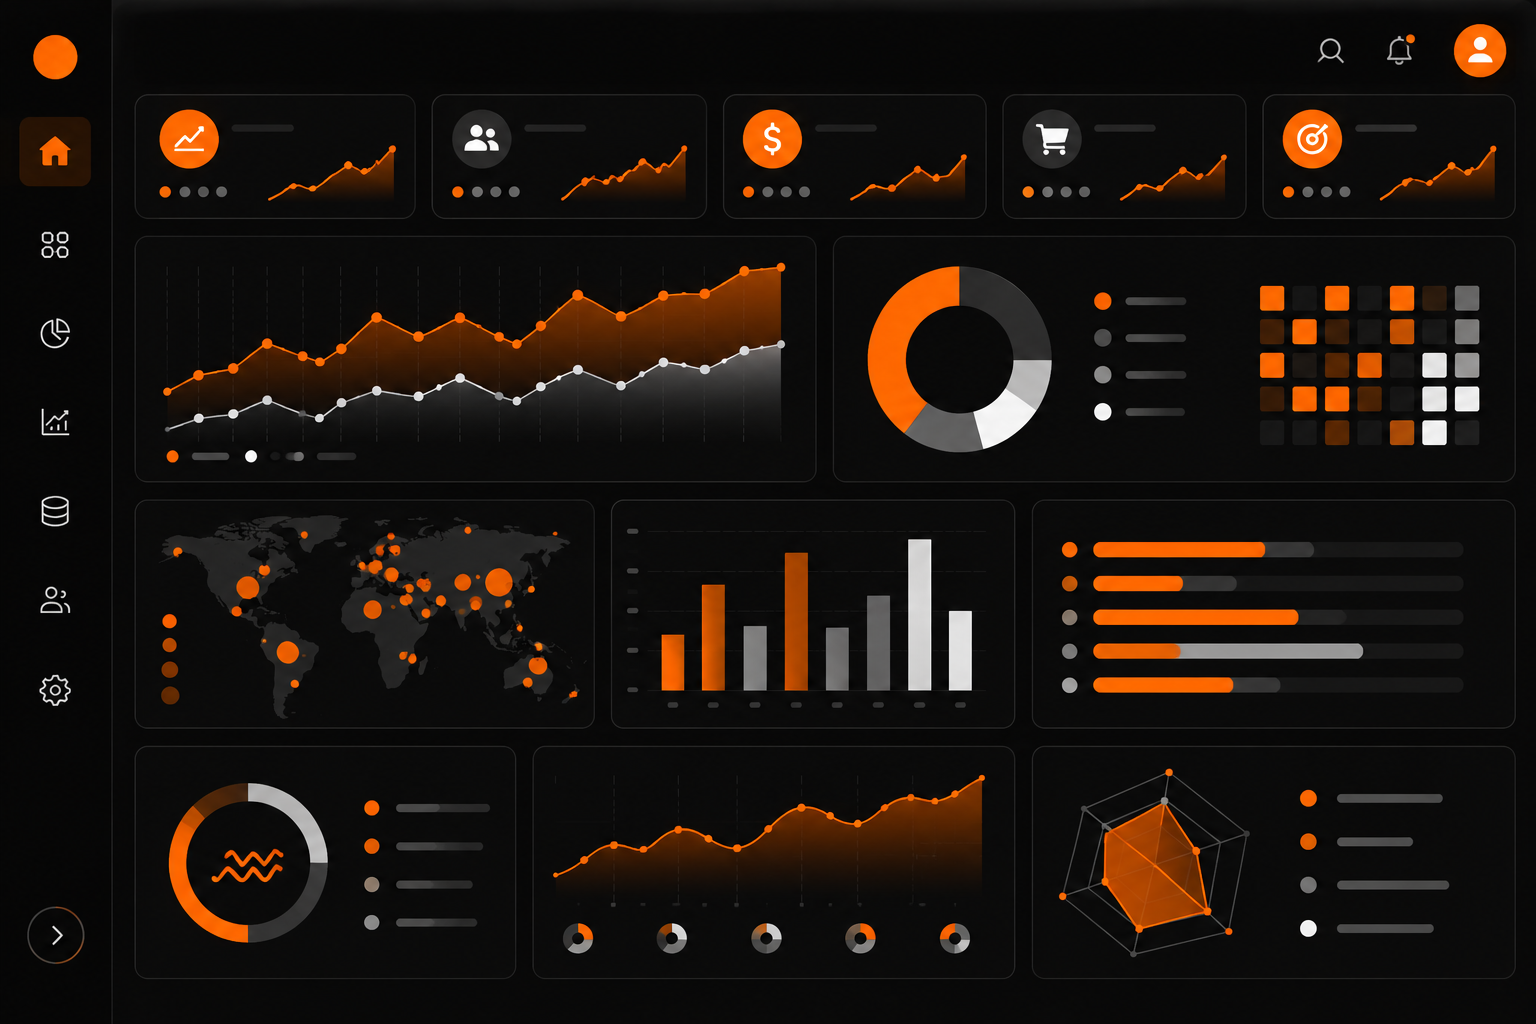
BI dashboards are data visualization tools that help businesses track key metrics, analyze information, and make data-driven decisions. They transform complex data into clear and interactive reports.
Modern dashboards combine data from multiple sources and present it in an intuitive and interactive format.
01When businesses need BI dashboards
BI dashboards are needed when data becomes complex and requires visualization for decision-making.
- Growing data volume
- Need for analytics
- KPI monitoring
- Multiple data sources
- Business process management
02What BI dashboards solve
BI dashboards enable fast data analysis and informed decision-making.
- Data visualization
- Performance monitoring
- Trend analysis
- Data comparison
- Decision support
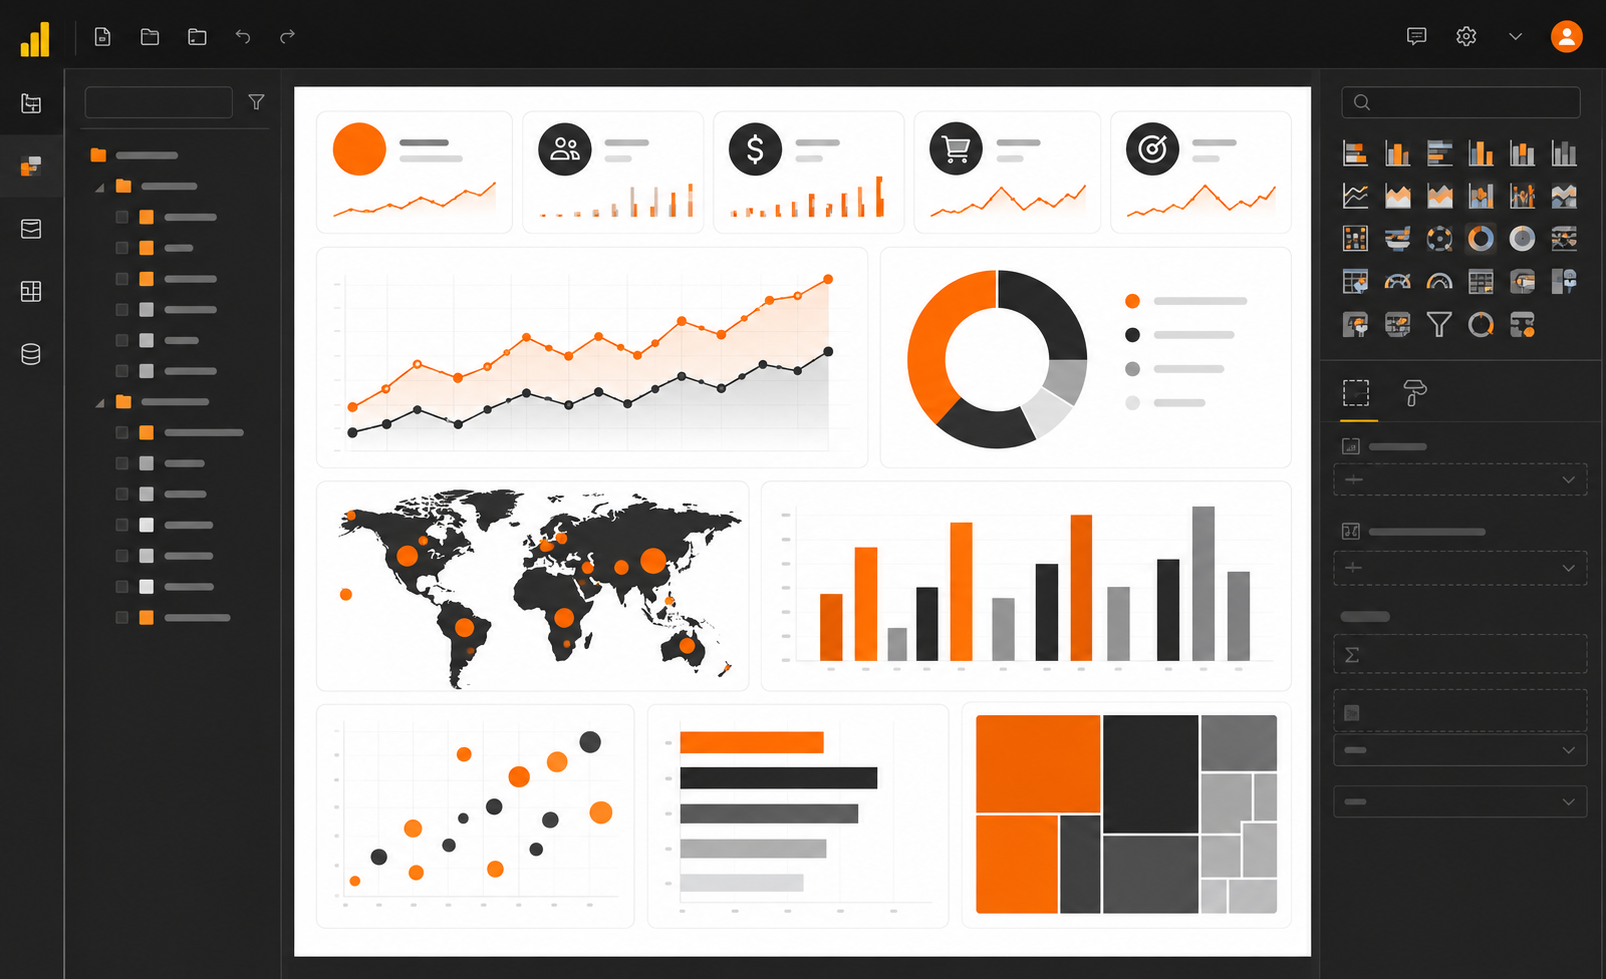
03Key dashboard elements
An effective dashboard includes several core elements.
- Charts and graphs
- KPI metrics
- Filters and segmentation
- Tables
- Interactive elements
04What we can build
We build BI dashboards tailored to business needs with a focus on clarity and usability.
- Business management dashboards
- Financial analytics
- Marketing reports
- Operational dashboards
- DWH and API integrations
- Automated data updates
- Custom visualizations
05Tools and technologies
BI dashboards are built using various tools.
- Power BI
- Tableau
- Google Data Studio
- Metabase
- Custom dashboards (React, Next.js)
06UX and visualization
A good dashboard must be clear and user-friendly.
- Clear structure
- Minimal clutter
- Color logic
- Intuitive navigation
- Focus on key metrics
07Development process
Dashboard development requires understanding data and business processes.
- Requirement analysis
- KPI definition
- Data preparation
- Visualization development
- Testing
- Launch and optimization
08Why it must be done right
Poor visualization can lead to incorrect conclusions.
A well-designed dashboard makes data clear and actionable.
09Business results
BI dashboards enable data-driven business management.
- Transparency
- Faster decisions
- KPI control
- Efficiency
- Business growth

Consultation request
Want to discuss a solution for your business?
Describe the task, and we will help define the architecture, implementation stages, and a practical delivery plan.